Lab 4: Finding memory errors with Valgrind
In this lab, you’ll use Valgrind, a memory error checker, to identify memory management mishaps in programs involving arrays and linked lists. Valgrind is ubiquitous in systems programming workflows, especially for programs written in C and C++. You’ll find it valuable for PA 2 and onward, too!
Lab 4 learning objectives
- Recognize the purpose of Valgrind in C programming
- Interpret output from Valgrind for memory-related problems
- Recognize Valgrind outputs for direct leaks, indirect leaks, use after free, and double free
- Use Valgrind to guide memory error fixing
Table of contents
- Icebreaker
- Part 1: Help! My program leaks…
- Part 2: Exposing bugs via automated testing
- Next steps
- Lab 5 Preview: Hacking
Icebreaker
If you could choose a superpower to have, what would it be? What would you do with it? Who’s your favorite superhero/villain, if you have any?
Please write the answers on your whiteboard. No check-off is needed!
Warm-up
Draw the memory diagram for the following linked list on your whiteboard. These function calls are similar to your PA, but we have simplified it for this activity. Show the week, days, and the events of each day.
   week_t finals = week_t("June 11th 2026 10am"); //7 days each week
   add_event(&finals, "June 12th 2026 10am", "June 12th 2026 11am", "Study");
   add_event(&finals, "June 12th 2026 12pm", "June 12th 2026 2pm", "Taco Bell");
   add_event(&finals, "June 15th 2026 3pm", "June 15th 2026 6pm", "Larp");
   remove_event(&finals, "Study");
   add_event(&finals, "June 15th 2026 7pm", "June 15th 2026 8pm", "Talk to Claude");
   add_event(&finals, "June 16th 2026 10am", "June 16th 2026 12pm", "Fail Exam");
   add_event(&finals, "June 16th 2026 1pm", "June 16th 2026 2pm", "Cry");
   add_event(&finals, "June 15th 2026 1pm", "June 15th 2026 2pm", "Love CSE29");
   reschedule_event(&finals, "Cry", "June 16th 2026 1pm", "June 16th 2026 5pm");
Before you get right into memory leaks and how to fix them, we have a quality of life improvement. Recall that in lab2 you made a pair of ssh keys to allow you to securely access github from your ieng6 account. There is another pair of keys we can make which give you the power to never have to type your password when signing into ieng6 again. The tutorial for this resides in the last lab: here.
Part 1: Help! My program leaks…
Please clone the GitHub repository for this lab’s starter code onto ieng6 in your cse29 directory. It contains code for a few programs that leak memory, and in this lab, we’ll use Valgrind to detect these leaks and help fix them. In this repository you will find a Valgrind directory, start here.
Let’s start with leak.c:
$ gcc leak.c -g -Wall -o leak
Remember -g from last week? This flag instructs GCC to add debugging symbols to the compiled executable. These symbols enable GDB to look up and show your source code during debugging. They also enable Valgrind to show you line numbers in its error backtraces.
Take a moment to review leak.c and predict what it should print, then run ./leak. Although running the program gives no visible errors, the program actually produced some memory leaks as a result of us not properly freeing the allocated memory. The Valgrind program allows us to see how much memory is still being used when the program exits, and therefore leaked. Like with GDB, you pass in the program to inspect as an argument to valgrind.
$ valgrind ./leak
We see a suggestion from valgrind to add --leak-check=full flag to instruct Valgrind to report the locations where leaked memory had been allocated:
$ valgrind --leak-check=full ./leak
Valgrind provides a “heap summary” of how much memory is still being used at exit, and a “leak summary” which details the different types of leaks that have occurred. When Valgrind reports anything in a leak summary, that means you have a memory leak! Memory leaks are especially harmful in long-running programs, where the amount of available memory gradually reduces over a long time, thereby also reducing the overall performance of the program or the computer in general.
Because we supplied the --leak-check=full flag, Valgrind also printed the stack trace at the instant where each chunk of leaked memory was allocated. You might be inclined to think that the problem lies around the line number it references, but this is usually not the case! Valgrind is just pointing out where the leaked memory got allocated. You, the programmer, decide where it is supposed to be freed. Sometimes, the appropriate place for a free call can be far away from its malloc call in your source code.
Types of Memory Errors
Unlike real life (plumbing) leaks, it’s okay to leave the (memory) leak in leak.c alone for now; we’ll come back to it later.
Memory leaks are especially harmful in long-running programs, where the amount of available memory gradually reduces over a long time, thereby also reducing the overall performance of the program or the computer in general.
In memory_errors.c, we demonstrate some common situations in which memory errors can occur. Rather than manually writing the compilation command, we’ve provided a Makefile for you to use. This will be helpful since we have quite a few files to compile in this lab. To compile a program, use the make command followed by the name of the file to compile without the .c suffix. For example, to compile memory_errors.c into the memory_errors binary file, use this command:
$ make memory_errors
In order to see more details of the leaked memory, make sure to add the --leak-check=full flag.
$ valgrind --leak-check=full ./memory_errors
With this flag, the Valgrind heap summary will also report the locations where leaked memory had been allocated, since we compiled the program with the -g flag.
Let’s go over each function in memory_errors.c in more detail, and fix each of them:
memory_leak(): In general, memory leaks occur when we allocate memory and do not free the memory before the program exits. Here, we fix the memory leak by callingfree()on the pointer returned bymalloc()which points to the allocated memory.free_after_set(): In this case, we lose the pointer to the allocated memory when we set it toNULL, therefore callingfree(p)does not do anything. In general, we consider it good practice to set a freed pointer toNULL, but it actually needs to be freed first! We can fix this by making sure to callfree()on the pointer before setting the pointer toNULL, instead of after.double_free(): This one isn’t actually a memory leak, but it’s an error that can occur with improper usage offree(), which is why it’s here. Callingfree()on a pointer that has already been freed is considered undefined behavior, meaning that it should not be expected to work properly. This program gives you a really messy memory error when you try to run it. Valgrind will also report an “invalid free” error above the heap summary. In this case, it’s apparent why the double free error occurs and how to fix it, but in other cases it may be more obscure.reuse_freed(): Also not a memory leak, but a case in which we try to access memory that was already freed. Valgrind reports this error as an “invalid write” above the heap summary. Again, it’s good practice to set a freed pointer toNULLimmediately after it’s been freed.double_malloc(): This can accidentally occur when you intend to allocate two blocks of memory to be used one after the other with the same pointer, but forget to free the first block. What should be done here to fix this leak?
Once you’ve implemented the fixes, compile and re-run the program with Valgrind to confirm that there are no longer any memory leaks or errors. It should report that “all heap blocks were freed – no leaks are possible”. Yippee! Although if there are still memory leaks/errors, try again, then yippee.
Types of Memory Leaks
You might have noticed in the leak summary of Valgrind that there are different types of memory leaks. The distinction between these leaks isn’t too important for our purposes, but may help you identify how leaks are happening in a more complex program.
In leak_types.c, we demonstrate each of the different types in separate functions. There’s no need to fix these leaks; just compile and run Valgrind on the program to see how Valgrind reports different types.
$ make leak_types
$ valgrind --leak-check=full ./leak_types
Notice how the heap summary gives you information on where each memory error occurs. Inspect the source code to see how each type is caused.
- Definitely lost: Besides myself, memory leaks are also considered “definitely lost” when the pointer to the memory becomes inaccessible. This can happen when the pointer is deleted when a function ends and its stack frame is deleted, or when the pointer is set to another value.
- Indirectly lost: Blocks of memory are considered “indirectly lost” when there exists a pointer in another leaked memory to the block. In this case, the memory pointed to by
pp(i.e.*pp) is definitely lost, and the memory pointed to by*pp(i.e.**pp) is indirectly lost. - Possibly lost: “Possibly lost” memory leaks occur when we have a pointer to some part of the leaked memory, but not to the base of the memory block, likely because the pointer was modified. In this case, we allocate an array of integers, then move the pointer to point to the middle of the array.
- Still reachable: Memory leaks are “still reachable” when the pointer is not lost when program exits, but the memory is still unfreed. This can occur when a global variable contains a pointer to leaked memory.
- Suppressed: Users can specify the flag
--suppressions=<filename>to Valgrind to intentionally ignore leaks that are known to be harmless or unavoidable. If you want to learn how to use this flag, you can check out this StackOverflow post, although in our (at least one old tutor and at least one old TA) experience this flag is seldom used, if at all.
Valgrind on Arrays
Now let’s put what you’ve learned into practice. In the lab repository, leak.c and losing_track.c have memory leaks. Try to identify and fix the problems in each program. Feel free to work with those around you!
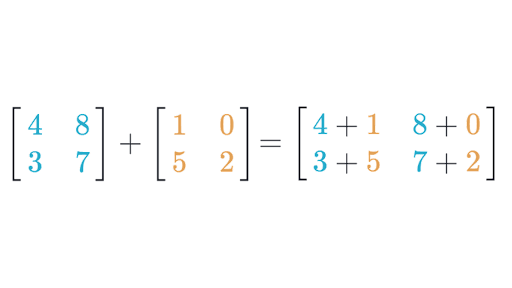
In leak.c, there is a function that performs matrix addition on two 2D arrays. While the functionality may appear correct, a run of valgrind will tell you that memory isn’t freed properly. For reference, here is a diagram of how matrix addition works:
Please check in with your teammates to make sure everyone understands leak.c and it’s problem and solution. If you have any questions now is a good time to ask a staff member as a group for any clarifications.
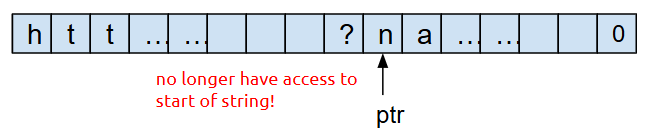
In losing_track.c, there is a function that returns the lower-cased version of the query string of a url without modifying the original string. This is the portion after the question mark in http urls that are often used to specify parameters for a website. We want to return this portion without modifying the original URL. Like previously mentioned, this function appears to work properly, but does not manage memory properly. This error is particularly nasty because this implementation loses track of its allocated memory. Let’s take a deeper look into what this means.
When we first initialize query, we point to the beginning of the string, and therefore have access to our whole chunk of memory. Our memory looks like this:
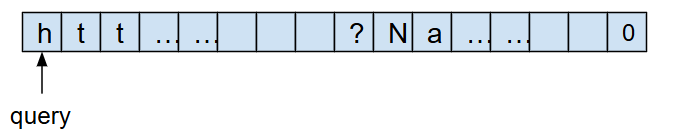
However, after we convert the string to lower case, use ptr to traverse through the string, and return ptr, we no longer have access to the beginning of the string, and therefore can’t free the chunk of memory!
Describe the problem and how you would fix it. Work with your teammates and write this on your whiteboard. Do leave yourself space to add 2 more similar descriptions and fixes.
Given time, you may implement the solution and check your work however implementing your solution is OPTIONAL. If you would like to implement your your solution, note that given this is a very involved change, please modify the method as much as you like!
HINT: the problem of the current implementation is that in the string we return, we don’t keep track of the beginning of the string. How can you change this code so that the string we return has its pointer pointing to the beginning?
Valgrind on Linked Lists
As we prepare for PA 2, let’s see how Valgrind can help us discover memory problems surrounding linked list implementations. Compile list.c and run it with Valgrind using the same flags from above. In this case, it should report that 32 bytes of memory have been leaked. Follow the stack trace shown by Valgrind to contextualize yourself with the “story” of the lifetime of this chunk of memory. When did it get allocated? When do you think it should’ve been freed? How can you fix it?
A common misconception is that we can free memory by redirecting pointers to that memory to NULL, the null pointer. You can draw a memory diagram to see that this won’t actually free that memory. Edit list.c so that the main function calls free_list instead of setting ourlist to NULL. Did this fix the leak?
Once you recompile and re-run with Valgrind, you should see a different error: Invalid read of size 8. This time around, Valgrind has a richer story to tell about this chunk of memory. Read the series of backtraces from the bottom line upward to see the events that took place in chronological order along with where they were triggered. Use this story to help understand the nature of the memory problem and figure out how to fix it. You can also pull out GDB if you’d like.
Once you fix this error, re-compile and re-run the list program with Valgrind, and make sure that Valgrind reports no errors and that “no leaks are possible”. Add the problem and solution to the whiteboard.
This is an example of “use after free”, accessing a chunk of memory after you have freed it. The program might still have worked prior to your most recent fix, but because it accessed and relied on data inside a chunk of memory after it was freed, the program was subject to undefined behavior—it could crash, corrupt other memory it owns, or do whatever it wants! Thankfully, Valgrind can detect most instances of undefined behavior and help you eliminate it.
“Double free” is a specific kind of “use after free” where a program tries to free a chunk of memory that has previously been freed. Let’s see how Valgrind reports instances of “double free”. Duplicate the call to free_list in main, and recompile and rerun it with Valgrind.
In addition to Invalid read of size 8, where free_list attempts to access the next member of a freed node, Valgrind also reports Invalid free() / delete / delete[] / realloc() arising from the first free() call inside free_list. Now you know!
Valgrind and uninitialized values
Another source of undefined behavior is reading from uninitialized memory. Valgrind can detect this, too! Compile writesong.c using the same flags as above, but now, run Valgrind with the following:
$ valgrind --track-origins=yes ./writesong
The program should write a simple song to mysong.txt using file I/O operations you will also encounter in PA 2. However, Valgrind reports several instances of “Conditional jump or move depends on uninitialised value(s)” and “Use of uninitialised value”, and because we included the --track-origins=yes flag, it shows us where each uninitialized value was declared. The reports seem to repeat, indicating that an uninitialized value was used in a loop. Read the contents of writesong.c to figure out the problematic variable and initialize it properly. Verify that Valgrind no longer reports these errors when you run the program.
You should now be able to tell if you’ve fixed the memory problem on your own! Add the problem identified and how you fixed it to your whiteboard.
Make sure to call over a staff member to go over your plan for how to fix the memory leak in losing_track.c, list.c, and writesong.c that are on your whiteboard.
As we have seen, Valgrind is useful for discovering memory bugs in your program. This will be especially useful in PA 2, where you will be graded on proper memory management as you query and sort your linked list and array. Alongside Valgrind, we cannot understate the usefulness of drawing memory diagrams in helping you reason about memory management and fix memory issues, especially for linked lists. They make memory management much more intuitive, so embrace them!
Part 2: Exposing bugs via automated testing
In this section, you will put your GDB and Valgrind skills into practice by finding and fixing bugs in an aviation-themed linked list program. You’ll also learn to write unit tests using assert statements to expose bugs. We hope that our introduction to testing helps you with writing your own tests in PA 2!
Negative, tester, the pattern is full…
You will be testing some bad implementations of some common linked list functions and finding out what’s wrong with them. Some of these implementations have memory leaks, others may be logically incorrect, and some of them just straight-up crash on certain inputs. It’s up to you to use all the tools in your debugging arsenal and all the knowledge you’ve gained to pick out the exact problem(s). Head to the Testing directory which is adjacent to Valgrind. Check out the flights.c file to take a look at the code you’ll be critiquing.
We will stick to the following step-by-step process to remove defects from this file:
- Write tests that expose an existing bug by failing, which can take the form of:
- An “Assertion failed” message
- Memory errors when the test is executed with Valgrind
- A program that never terminates
- Use Valgrind and GDB to inspect how the tests failed
- Implement a fix such that the tests pass
Bad Free Path
Our recent lectures have mentioned the assert function. Given some argument arg, it checks if arg is true. If true (nonzero), it returns normally, and the code after the call to assert proceeds. If false (zero), it crashes the program immediately with an error message that includes the line number of the failing call to assert. While we can use the assert function to verify assumptions in linked list procedures, it is also essential in automated tests. assert function calls in automated tests check for an expected outcome. For example, a test may conceptually sound like:
If I create an empty list, and I then call
add_item_fronton this list with5, then (I assert that) the list should now contain one node withdataequal to5.
Let’s start with bad_free_path_1. Around line 101 in flights.c, we have written an example test for you. Compile flights.c with the -g flag, and run it with Valgrind. Identify and make your fixes to make our test pass with no errors from Valgrind. Feel free to write more tests to check more cases.
💡 Drawing diagrams is very useful for wrapping your head around linked lists. If you’re stuck, draw a diagram! There’s a reason why almost every staff member relies on a drawing of nodes and connections when explaining linked list operations.
Test-First Development
Feel free to skip this note and come back to it later.Most programming courses in higher education adopt a “Test-Last” approach, where we first write the implementation and then write tests to verify its correctness. What if we flip this order? The Agile programming community has advocated for Test-First Development (TFD), where whenever we want to develop a new feature, we first write tests (that would obviously fail), and we then write the implementation with the goal of making the tests pass. While this sounds counter-intuitive, following it in a disciplined manner has several benefits for software engineering:
- TFD promotes high test coverage, meaning tests exercise many (if not all) parts of your implementation code
- TFD encourages you to refactor your code, i.e., restructure it for performance, maintainability, etc. without worrying that you might break something because you can easily find out by running your tests
- Some argue that TFD makes programming more fun and rewarding. Writing a test is like giving yourself a challenge, and seeing it pass for the first time is gratifying. On the other hand, writing tests last can seem like a chore.
However, TFD is criticized for its counter-intuitiveness, repeated context switching between testing and implementing, and being unsuitable for input/output applications. While we are not in a position to officially recommend Test-First Development, we want you to try it with your next PA and see if you like it.
Now that we have seen how an assert works for writing a few test cases and catching bugs, we shall write our own. We have given you 2 broken functions, bad_remove_element and bad_insert_element_at_pos.
Bad Remove Element
There are 2 problems with bad_remove_element in flights.c. One will be caught by Valgrind, and the other we will have to find using asserts. Write assert statements to test this function, including one which should fail. Some test cases we usually want to consider when dealing with lists are what happens at the beginning, the end, and somewhere in between. Here’s an example test you could write:
- Create a path LAX→SFO→PDX
- Use
bad_remove_elementto remove the first item, LAX - Assert that the first item of the list is now SFO
- Assert that the second item of the list is now PDX
Now that we have successfully found in which case the program does not give us the desired behavior, it is easier to pinpoint where in the code there is a problem. For the second problem, keep in mind that for every malloc there must also be a free and vice versa. Use this to help you fix the function.
Bad Insert Element
At this point, you are probably getting bored of the uninspired section names. What we hope you haven’t gotten bored of is writing tests, because that is what you will be doing yet again.
The bad_insert_element_at_pos function takes in a path, the name of a new airport name, and an int pos. It should insert a new airport with the given name, into the path, at the given position. For example, if we are given the path LAX→TPE→PEK, and we pass in “SIN” for the name, and 1 as the pos, we would expect the path to become LAX→SIN→TPE→PEK. Note that the index of SIN is now 1. If pos is equal to 0, the function should update the value of *path to communicate the address of the new first node to the function caller. For another example, starting with LAX→TPE→PEK, and passing in 3 as the pos, and “HND” for the name, we would expect LAX→TPE→PEK→HND.
Use these examples to help you write tests that expose the bugs in bad_insert_element_at_pos.
After finding the bug, now you should be able to debug the code and implement a working solution.
Next steps
If you finish with the lab content above you may any do the following:
- Go back to the “On your own time!” sections and do them.
- Continue reading and work on the buffer overflow task that was also available last week. Surprise! it was a lab5 preview all along.
- Work on PA2
Lab 5 Preview: Hacking
5.1. Background
Imagine that you’re a less ethical student than I’m sure you actually are. You overhear from some other students in lab that there’s a binary available on the pi-cluster that can show you your grades on assignments before we formally release them. You hear quieter whispers that someone found a way to use it to change their grade. Given our less-than-ethical assumption about your state of mind, you might be tempted to exploit this for yourself.
5.2. The Plot Thickens
You see some code open on the professor’s laptop during office hours. You do your best to commit it to memory and write it down (remember, you’re acting quite unethically in this story), because it strikes you that the code was something regarding assignment scores.
Using this information, you decide to give yourself and A with a score to match while maintaining a real due date.
HINT When important values are adjacent on the stack, overflowing an array with values that you control can let you assign into other stack-allocated values.
GDB commands that may be useful for this activity:
-
(gdb) info locals -
(gdb) info args -
(gdb) print VALUE (or p VALUE)You can print any variable or expression, e.g. -
print x,p arr[5],p ((x & 0b1111) << 3) -
You can also specify a format to print in
-
print/t(binary),print/x(hex),print/d(decimal) -
(gdb) x ADDRESSThis prints out memory at an address, e.g. strings / arrays / pointers -
(gdb) x/16cb str1This prints the first 16 bytes ofstr1as characters -
(gdb) x/20xb str2This prints 20 bytes ofstr2in hex -
(gdb) x/4dw arrThis prints 4 “words” (i.e.int32s) ofarr, as decimal numbers -
You can use the following reference card for reference on gdb commands, and format commands for x and print.