Lab 3: Debugging with GDB
In this lab, you will get hands-on experience using GDB to debug C programs. GDB will become an essential tool for your PA work as this course develops, so lock in!
Lab 3 learning objectives
- Recognize the need for debugging using a debugger
- Compile a C program for debugging
- Catch possible bugs using a compiler
- Run a program in GDB while stopping at breakpoints
- Use various GDB commands to observe and control program execution
- Use GDB to troubleshoot a crashing program
Table of contents
- Whiteboard activity #1
- Part 1: -W(arn)all
- Part 2: What and why debugging?
- Debugging Activity
- Part 3: TUI, Commands, Segfault, and BackTrace
- Identify yourself to ieng6
- Next steps
- Lab 4 Preview: Hacking
On the quest I sent a staff member to gather information about ieng6, success was achieved. Some guy of ITS (IT Services) has answered many questions.
“For some history, ieng stands for “Interactive Engineering” and dates back to when we had machines in AP&M that you had to use a video terminal to interact with the machines. The 6 in the name is from the IP Address originally assigned, which was 132.239.50.6. There used to be other “ieng” machines, you may encounter someone that remembers ieng9 that used to host Solaris SPARC used in CSE30 and CSE120.
ieng6 and almost all of the infrastructure students might use is physically located in SDSC. The ieng6 machines are entirely virtual machine based so they’re balanced on a cluster of hardware supporting most ITS.
ieng6.ucsd.edu is a round robin load balancer that currently balances number of connections between ieng6-201, 202, and 203 (this will be increasing this summer). 201-203 are SSH only machines, everything else also allows RDP desktop sessions which you can connect to from campus/VPN or via linuxcloud.ucsd.edu. All the ieng6 machines are open to use as needed but we may point courses at specific sets of machines depending on what’s needed for the course.
ieng6-240 - 253 are the original desktop cluster and the number is based off their IP address.
$ host ieng6-240
ieng6-240.ucsd.edu has address 128.54.70.240
ieng6-640 and ieng6-641 were originally the first x86_64 deployments and are currently used to support old software that needs CentOS 7.
ieng6-700 through 702 and ieng6-300 through 309 are higher resource machines (more memory + CPU) which were added as we needed to support more intensive desktop software/more desktop sessions total during covid.
ieng6-ece-01 through 20 are machines specifically for ECE courses.
There used to be igpu-### machines which were GPU compute servers that eventually turned into the DSMLP cluster.
For home directories, the old style “OCE” paths means your account was setup prior to May 2025 and didn’t get migrated to the new format. I don’t know the particular history on how that hash layout was developed but it was in use for 30+ years. Accounts used to need to be flagged as “Open Computing Environment” to get persistent storage and compute resources that you can use outside of a specific course, which mattered a lot more when disk and cpu resources were limited. Non OCE accounts used to look like “cs29sp26aa” and were allocated for specific courses and removed after the quarter.
New accounts are standardized with the home directory bin being the last 3 digits of your UID. Note your UID is 112263
$ getent passwd etomson
etomson:*:112263:20:Tomson, Elena:/home/linux/ieng6/students/263/etomson:/bin/bash”
SDSC is the San Diego Supercomputer Center which resides near RIMAC on Ridgewalk.
Whiteboard activity #1
Icebreaker
The CSE 29 genie, which runs on ieng6, would like to grant you 3 wishes. You may wish for anything you want, except you may not wish recursively (i.e., wish for more wishes). What do you wish for?
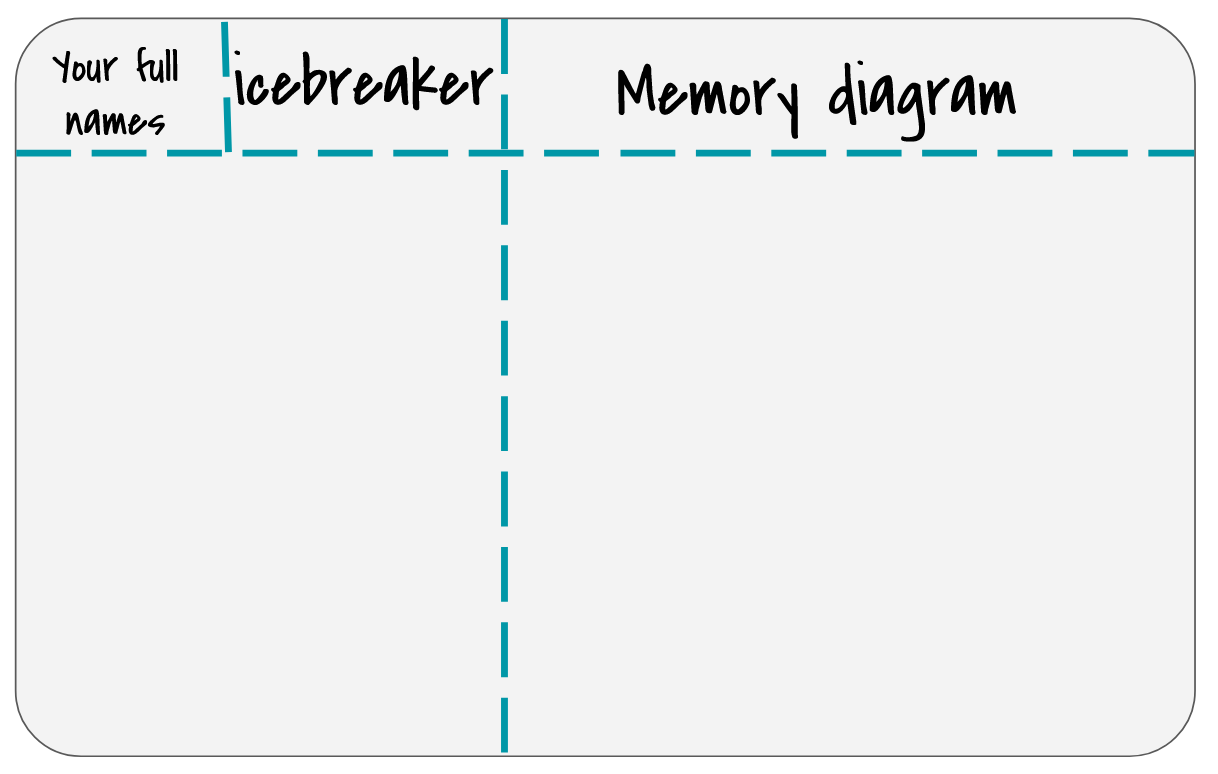
Please write the answers of yourself and one of your group members on your whiteboard.
Warm-up
Draw the memory diagram for the following 2D array on your whiteboard.
int ** arr = malloc (4*sizeof(int *));
for(int i = 0; i < 4; i++){
    arr[i] = malloc(3*sizeof(int));
}
for(int i = 0; i < 4; i++){
    for(int j = 0; j < 3; j++){
        arr[i][j] = j + 4*i;
    }
}
At approximately 10 mins into the lab, the staff members present will bring the class together to go over the board. If you finish the whiteboard and icebreaker before that time, feel free to read the next section.
Color ls
- if you did not opt to make your
lscolorful in week1, now is the time. - Run
echo alias ls=\"ls --color\" >> ~/.bash_profile- if you have file permission issues, you can use
chmod u+rwx ~/.bash_profile
- if you have file permission issues, you can use
- you can use
source ~/.bash_profileto apply these changes right now.
Part 1: -W(arn)all
Our compiler gcc is designed to catch possible errors at compile time and warn you. While it gives you some of these warnings by default, we can force it to display all possible errors it detects by telling it to W(arn) all using -Wall flag. We can add this flag as follows:
gcc myprogram.c -o myprogram -Wall
The order of flags given to gcc does not matter. The only space-seperated string where the order matters is if the flag is followed by an argument. -o is followed immediately by what the binary file should be named as.
Using this repository navigate to the Wall directory and fix the programs. All bugs will be reported by compiliing using the -Wall flag
Part 2: What and why debugging?
Debugging is the practice of finding and fixing errors in programs. There are no real bugs in your program, although this has actually happened at least once before.
Like programming, debugging is also an incremental process. Programmers often need to isolate and debug one error at a time, rather than all errors at once.
We could insert some print statements into our code to try and figure out what’s going on—for small programs, print statements are often enough! However, there are several situations where we would want to use a debugger instead:
- If your program reports a segmentation fault, it can be difficult to pin down exactly where the segfault took place using print statements. A debugger can pause your program when it crashes and enable you to inspect its final state.
- If you are searching for a bug in a loop with many iterations, searching through print statement output from that loop can be quite cumbersome.
- You might work on a program for which you can’t see the output of print statements (like your web browser or vim itself). In this case, the debugger is a convenient tool for inspecting program state.
GDB (GNU Project Debugger) is a command line program that offers a convenient way for us to pause execution at any point in the code, manually inspect the values of any variable in the scope, and walk through the program step-by-step.
Debugging Activity
The gdb directory contains several programs which we will debug with GDB: index_of_E and charshift.c. We’ll start with the index_of_E program to introduce basic GDB commands, then look at charshift.c to talk about segmentation faults and how to debug them with GDB.
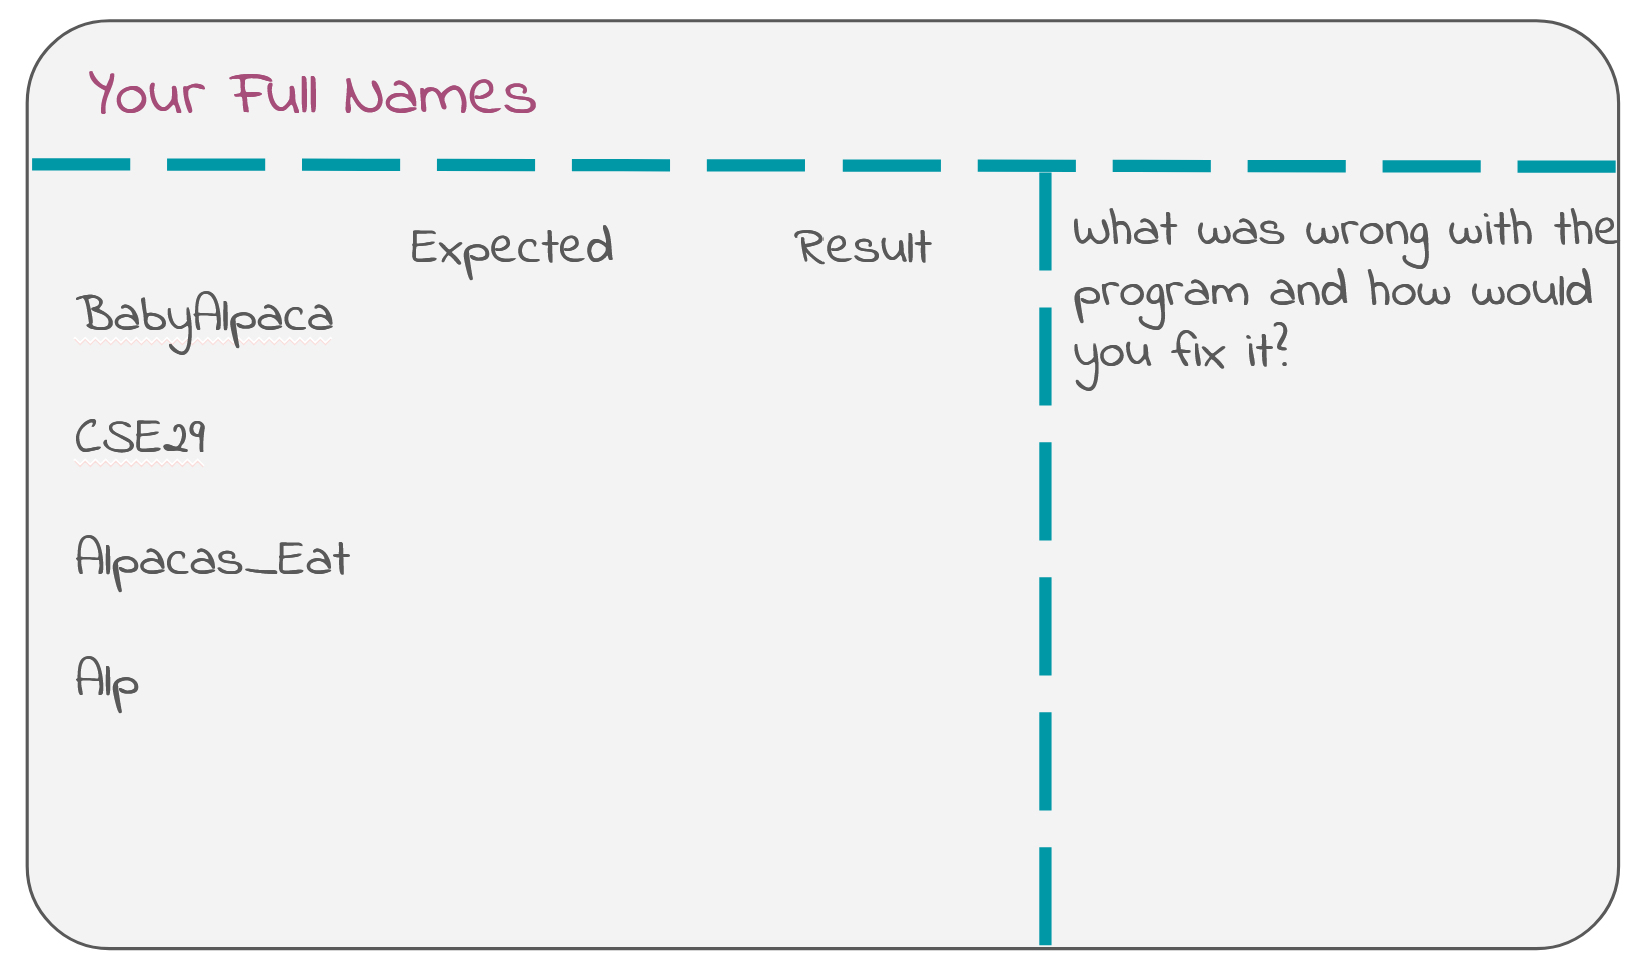
The correct behavior of index_of_E is to find the index of the first occurrence of the character E in a string str.
Predict the output for the following strings, “Baby_Alpaca”, “CSE29”, “Alp” and “Alpacas_Eat”. Fill out your whiteboard, leaving some extra space for your later bug fix like so:
Compiling for GDB
In order to use GDB, we have to compile our program with the -g flag. This tells the compiler to add some extra information to your executable file, which GDB will use. index_of_E was compiled using the following command.
$ gcc -o index_of_E -g index_of_E.c
Running in GDB
To run the program in GDB, use the gdb and pass the program as an argument:
$ gdb ./index_of_E
This will spit out several lines of text, with some software and legal information that we don’t need to worry about. In the last line, you should notice that the terminal command prompt $ (as well as the other stuff before $) has been replaced by the GDB command prompt (gdb). This means that the GDB program is active and ready to receive commands.
Use the run command to run the program in GDB. Since this program takes in a command line argument, you can provide it like so:
(gdb) run CSE29_is_fantastic!
This is just like running the command ./index_of_E CSE29_is_fantastic!. For now, it runs through the program without stopping. GDB might say something here about “Missing separate debuginfos”, but don’t worry about this. GDB is just asking to install some extra packages to get more information for debugging, but these aren’t necessary for our purposes right now.
To quit out of GDB, you can use the quit command.
(gdb) quit
In the future, please add -Wall to your compilation command to ask the compiler to help you find potential bugs.
Breakpoints
To pause execution at some point in the program, we have to set a breakpoint. Restart gdb ./index_of_E. Use the break command and give it a location in the source code that you want to pause execution at. At the moment, we’re not too sure exactly which part of the code is wrong, so we’ll pause at the beginning (the main function) and go step-by-step from there. You can use either
(gdb) break main
to automatically set a breakpoint wherever the main function is. which happens to be line 12 in index_of_E.c, or if you had the source code and knew the line number:
(gdb) break index_of_E.c:12
to set a breakpoint at line 12 in the file index_of_E.c, You can set breakpoints at any line in a source file, but usually we find it helpful to set them at the start of functions, to investigate the behavior of a function from its beginning.
You can use the info breakpoints command to list out which breakpoints have been set, as well as some information about where they are and what their associated number is. You can delete breakpoints with the command delete <number> where <number> is the number associated with the breakpoint.
After setting a breakpoint, you can run the program again (copy the run command from earlier) and see that it pauses execution right where the breakpoint is.
Part 3: TUI, Commands, Segfault, and BackTrace
TUI in GDB
Notice that GDB printed out a single line of code from the source file. This is the line of code that is about to be executed next. Here, you can use the list command to print out some of the surrounding code. This can be helpful to contextualize where the code is running.
The layout src command may also be helpful to enable a TUI (Text User Interface) for GDB that automatically renders a portion of the source code in the top half of the screen. The highlighted line in the TUI shows which line of code is to be executed next. To disable the TUI, use tui disable. Alternatively, press Ctrl + X, followed by A.
(gdb) layout src
The TUI won’t render any source code unless there is a program that is active, i.e. in the middle of execution.
Sometimes the TUI can get messed up if the program prints something out (which index_of_E does). When this happens, try using the refresh command to refresh the TUI and hope that it will restore its correct format. If something seems really messed up, try disabling and re-enabling the TUI.
On the left hand side of the TUI, you can see that the breakpoint is marked with B+>.
Basic GDB commands
After setting a breakpoint and running, execution is paused right after we enter the main function, before any other code is executed. You can verify this by using the print command to print out the contents of the variable result:
(gdb) print result
and see that it contains an uninitialized value. We see this because the line that initializes the variable has not been executed yet.
To run the next line of code, we use the next command:
(gdb) next
The highlighted line has moved on, indicating that the previous line has been executed. You can check the values of argc and argv using the print command, which accepts any valid expression in C:
(gdb) print argc
(gdb) print argv
(gdb) print argv[0]
(gdb) print argc < 2
Let the program finish by using the continue command. Does its output match what you expect?
We now know that this input exposes a bug inside index_of_E, so we want to look into this function with GDB. Let’s restart the execution and make line-by-line steps. Run the break main command to have the program stop when the main function begins, and then use the run command to start the program again.
Use next to execute the program up until, but not actually executing, the call to index_of(). You’ll know that index_of() is next to be executed, but not executed yet, when the line of code is highlighted. This time, instead of using next to run the entire index_of() function at once, use the step command to step into the function and begin executing line-by-line from inside:
(gdb) step
GDB also provides shortcuts for some commonly used commands, which can be used in place of the full command name. Some of those include:
rforrun,qforquit,bforbreak,pfornfornext, andsforstep.In addition to shortcuts, inputting no command and pressing
Enterwill automatically execute the most recently used command. This can be helpful when you need to usenextrepeatedly.
Then continue using next to run through the loop and figure out why index_of() is buggy. Try printing out the relevant variables as you go through each iteration. Once you figure out why index_of() isn’t working, write what the problem was along with how you would fix it on your whiteboard.
Ask a staff member to check the fix for index_of_E on your whiteboard.
This buggy program demonstrated an example of a logical error. A logical error is one in which the behavior of the program is different than what we expect it to be, without refusing to compile or crashing at runtime. However, before your fix, it was theoretically possible for this program to crash—why do you think it was? Feel free to verify your thoughts with your peers, tutors or TA.
When you tried to print
strinsideindex_of_E, GDB printed the entire string, just as we expected. However, what if you want to print the contents of an integer array passed into a function?If you’d like, try this with
contains.cfrom our previous labs (you canwgetour version if you don’t have one—visit Lab 2’s instructions for the command). When you try printing outarrlike you did while inmain(), you’ll realize that it prints out some hexadecimal number, instead of its contents. This happens becausearris passed intocontains()as a pointer to the start of the array. The hexadecimal number you see is the address of the start of the array. You can useprint *arr(arrwith the dereference operator*) to dereference the pointer and get the value at the start of the array, orprint *arr@NUMto print out the values stored at addressarrand the nextNUMaddresses. This means you can useprint *arr@6to print out all of the contents of the size 6 array.
Segfault and Backtrace
Another common type of error is a segmentation fault (or just segfault). Segmentation faults can happen when we try to access someplace in memory illegally (yes, that’s the technical term). In charshift.c, we’ll look at an example of that.
Compile charshift.c for GDB and try running ./charshift. It should immediately crash and give you a Segmentation fault (core dumped) error, telling you that some kind of illegal memory access happened. Most unhelpfully, the error message does not care to tell you why or even where it happened. Somewhat helpfully, GDB can at least answer the “where”. From this lab onward, whenever you see your program segfaulting, you should consider debugging it with GDB.
Start GDB with the charshift program. This time, instead of setting a breakpoint, we can let the program run through and give us a segmentation fault. GDB immediately tells us where the segfault happened and gives us a line number. From the output, we can see that the segfault occurred in shift_chars(), where we attempt to dereference the pointer and see if it is in the range of capital letters. But main() calls shift_chars(), so which one is the one causing the error?
Here, we can use the backtrace command (or the shorter bt) to show a backtrace (also called a stack trace) of the functions that were called leading up to the segfault. The output shows that the segfault happened in shift_chars(), when shift_chars() was called from main() at a certain line. This helps you discern which specific call to a function causes a segfault, when you have multiple calls to the same function. Feel free to run layout src to help you find the line referenced from the backtrace.
Since we know that segfaults are caused by illegal memory access, and we know that line 6 in charshift.c caused a segfault, we can infer that ch probably contains an address that the program can’t access legally. Confirm this by running print ch. Then, run print str to see the address of the beginning of the message. What do you notice between these two addresses, and what does that imply about the loop in shift_chars? This should help you pinpoint and fix the bug. Feel free to work with your peers and ask your tutors/TAs for a hint if you’re stuck!
Debugging practice
There are 3 buggy programs in the
gdbdirectory with namesbuggy*.c. Use what you have learned in this lab to fix these programs.
Identify yourself to ieng6
With this setup, each time you log in to your ieng6 account, you have to type the password. This can get a bit tedious. Luckily, there is a cool and interesting way to avoid this while still staying secure using SSH keys. You should perform the following on the device your frequently ssh into ieng6 from, not particularly on a lab computer.
- Verify that you are not logged into
ieng6. If your prompt does not contain the stringieng6, then you’re probably not on it. - Run
ssh-keygen -t rsa -b 4096. This command will generate a pair of SSH keys for you: one public (ends in .pub) and one private. If the program claims that the keys already exist, answer theOverwrite (y/n)?prompt withnto prevent overwriting your existing keys. Otherwise, keep pressing<Enter>until the program shows some text it calls the “randomart image”. - Expand the instructions that match your system below:
If your prompt ends with $ or % or #, not > (macOS, WSL, Linux) (Click to show instructions)
Runssh-copy-id username@ieng6.ucsd.edu, and enter your password (one last time). The program should claim that it has installed your key. If your prompt ends with > (Windows) (Click to show instructions)
- Log into ieng6 with
ssh(using your password as usual) - Run
mkdir -p .sshin the terminal - Log out of your remote account by pressing Ctrl+D or typing
exit. - On your local machine, run the following command:
type $env:USERPROFILE\.ssh\id_rsa.pub | ssh username@ieng6.ucsd.edu "cat >> .ssh/authorized_keys"
(Credit to Christopher Hart for this convenient command. Please note if the above command does not work, copy in your full path to the SSH key)
Try to log onto your remote account again. You shouldn’t be prompted for a password anymore. If you are, ask for help and carefully review the steps above with your group.
Next steps
If you finish with the lab content above you may any do the following:
- Continue reading and get a sneak-peak on topics covered in lab 4! 👀
- Work on PA1
- Work on HW3
Lab 4 Preview: Hacking
4.1. Background
Imagine that you’re a less ethical student than I’m sure you actually are. You overhear from some other students in lab that there’s a binary available on the pi-cluster that can show you your grades on assignments before we formally release them. You hear quieter whispers that someone found a way to use it to change their grade. Given our less-than-ethical assumption about your state of mind, you might be tempted to exploit this for yourself.
4.2. The Plot Thickens
You see some code open on the professor’s laptop during office hours. You do your best to commit it to memory and write it down (remember, you’re acting quite unethically in this story), because it strikes you that the code was something regarding assignment scores.
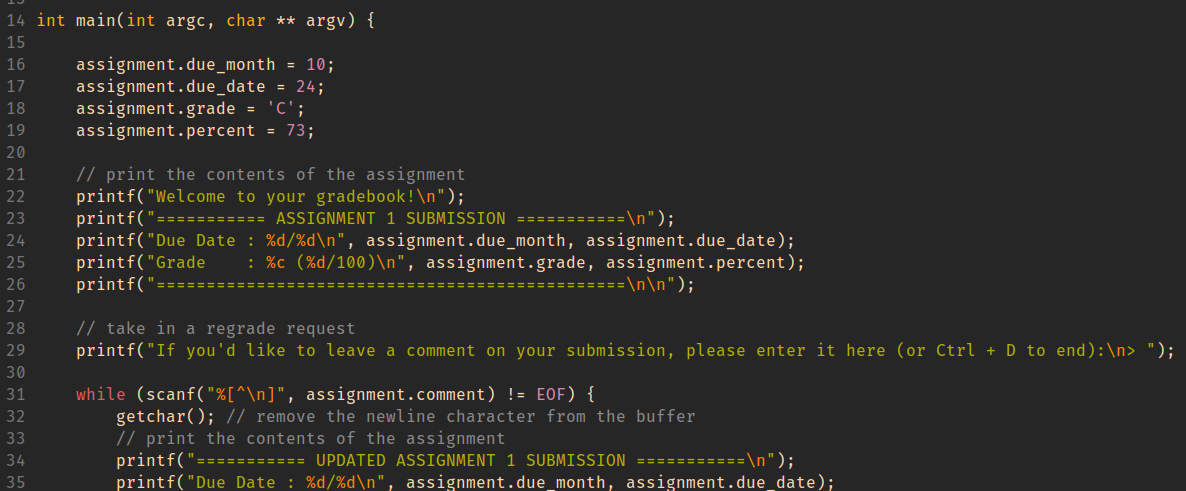
Using this information, you decide to give yourself and A with a score to match while maintaining a real due date.
HINT When important values are adjacent on the stack, overflowing an array with values that you control can let you assign into other stack-allocated values.
GDB commands that may be useful for this activity:
-
(gdb) info locals -
(gdb) info args -
(gdb) print VALUE (or p VALUE)You can print any variable or expression, e.g. -
print x,p arr[5],p ((x & 0b1111) << 3) -
You can also specify a format to print in
-
print/t(binary),print/x(hex),print/d(decimal) -
(gdb) x ADDRESSThis prints out memory at an address, e.g. strings / arrays / pointers -
(gdb) x/16cb str1This prints the first 16 bytes ofstr1as characters -
(gdb) x/20xb str2This prints 20 bytes ofstr2in hex -
(gdb) x/4dw arrThis prints 4 “words” (i.e.int32s) ofarr, as decimal numbers -
You can use the following reference card for reference on gdb commands, and format commands for x and print.